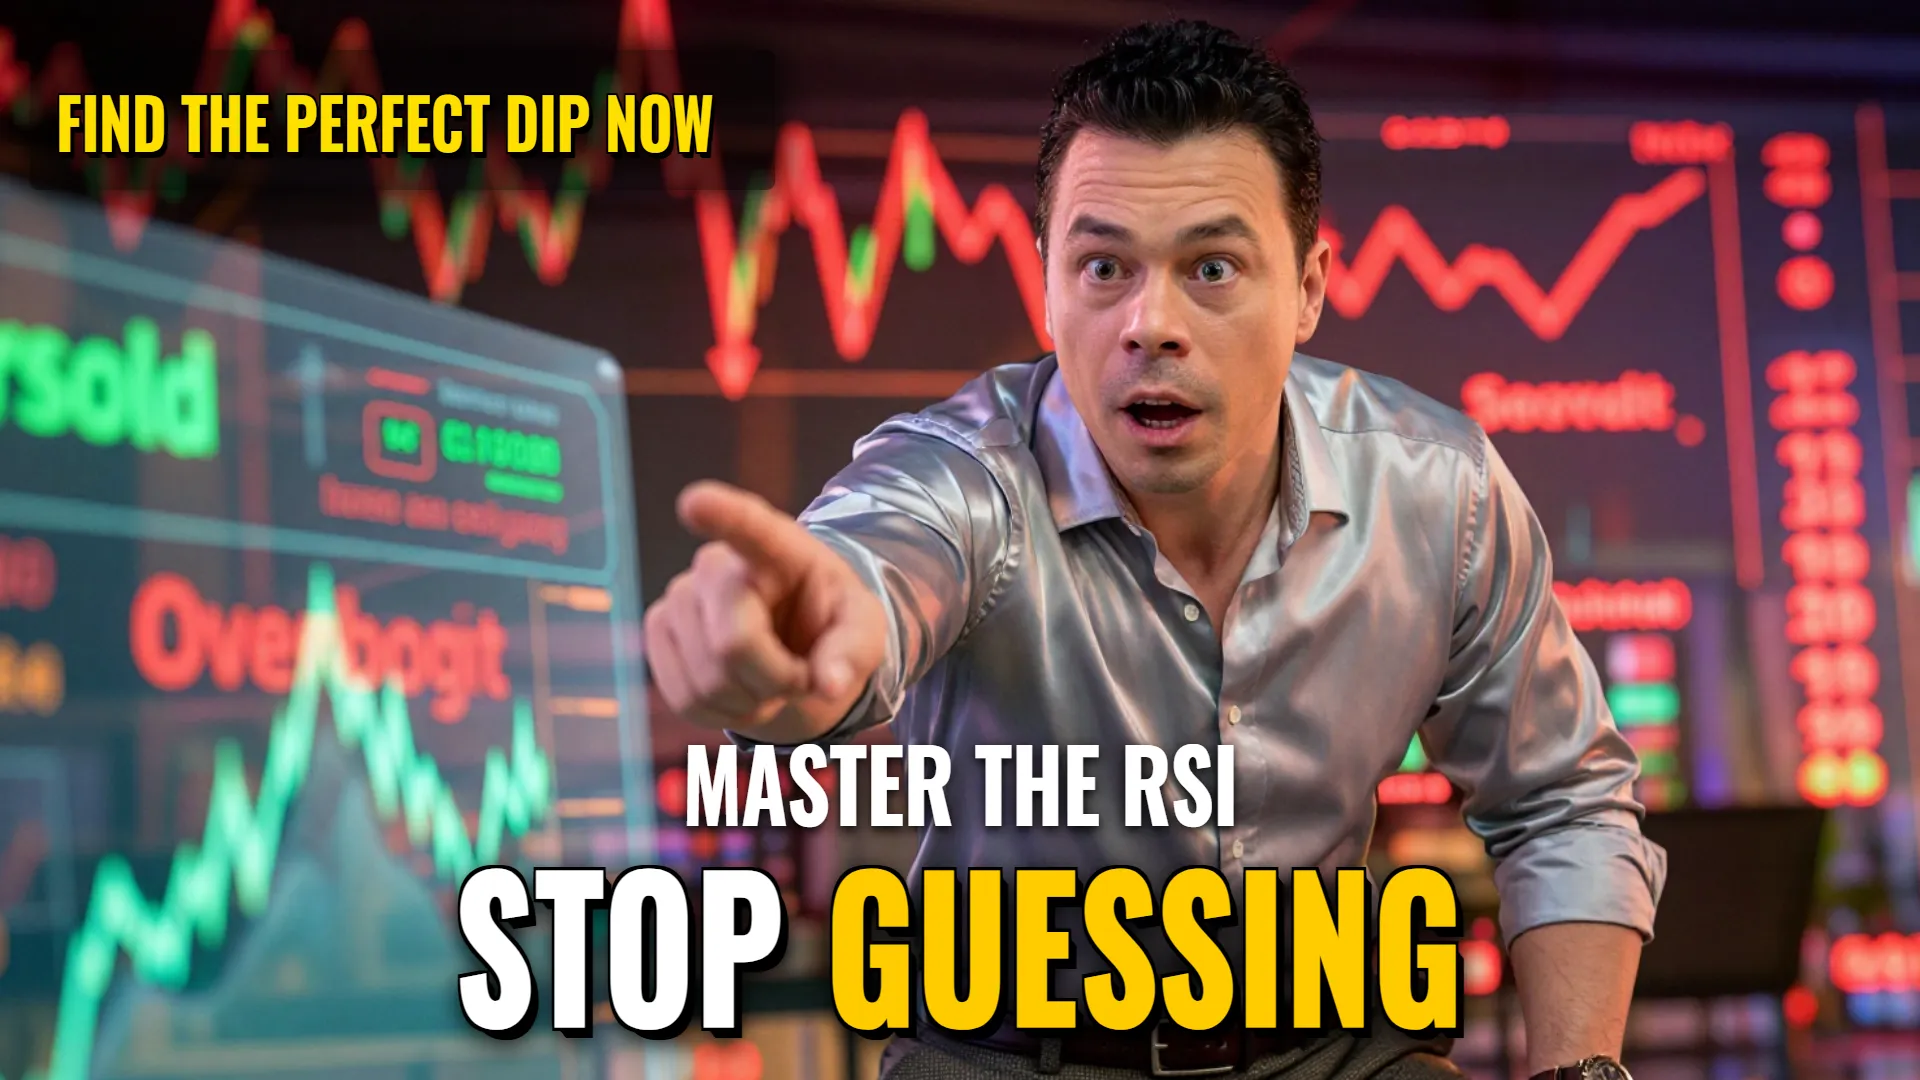
Mastering the Crypto RSI Dashboard
The RSI is an oscillator that measures market sentiment and momentum to determine if assets are potentially ableto move higher or lower.
What is it?
The RSI monitors whether certain crypto assets sit in extreme price territories like oversold or overbought zones. It helps traders understand when enough selling own has occurred or if buying pressure may be reaching a limit.
How to Read it
- Oversold Territory: When a high percentage of assets fall below specific levels (e.g., current data shows 37.9% of assets sitting in oversold territory), this signals potential buying opportunities ("buying the dip").
- Overbought Territory: If any way above standard thresholds, such as only 1.9% currently being overbought, indicates limited upward exhaustion risk for those unable to buy further right now.
- Trend Direction: A drop in average RSI (such as dropping from 50.05 down to 35.97) suggests increasing bearish momentum across the general asset pool.
Practical Setup
- Access your preferred charting tool via https://coinmarketcap.com/charts/rsi/.
- Apply the Relative Strength Index (RSI) indicator settings.
- Monitor the global heatmaps and dashboard averages rather than just single coins.
- Identifyif common market sentiment—represented by the Average RSI—is trending downward toward an able-to-buy zone near certain support baselines.
Pro Tip: Use the RSI heatmap or dashboard instead of looking at individual price action alone; spotting when enough massed volume sits in extreme zones helps confirm if you are truly "buying a healthy dip" versus catching falling knives.
! DYOR (Do Your Own Research)